Body text
Geomagnetic storms
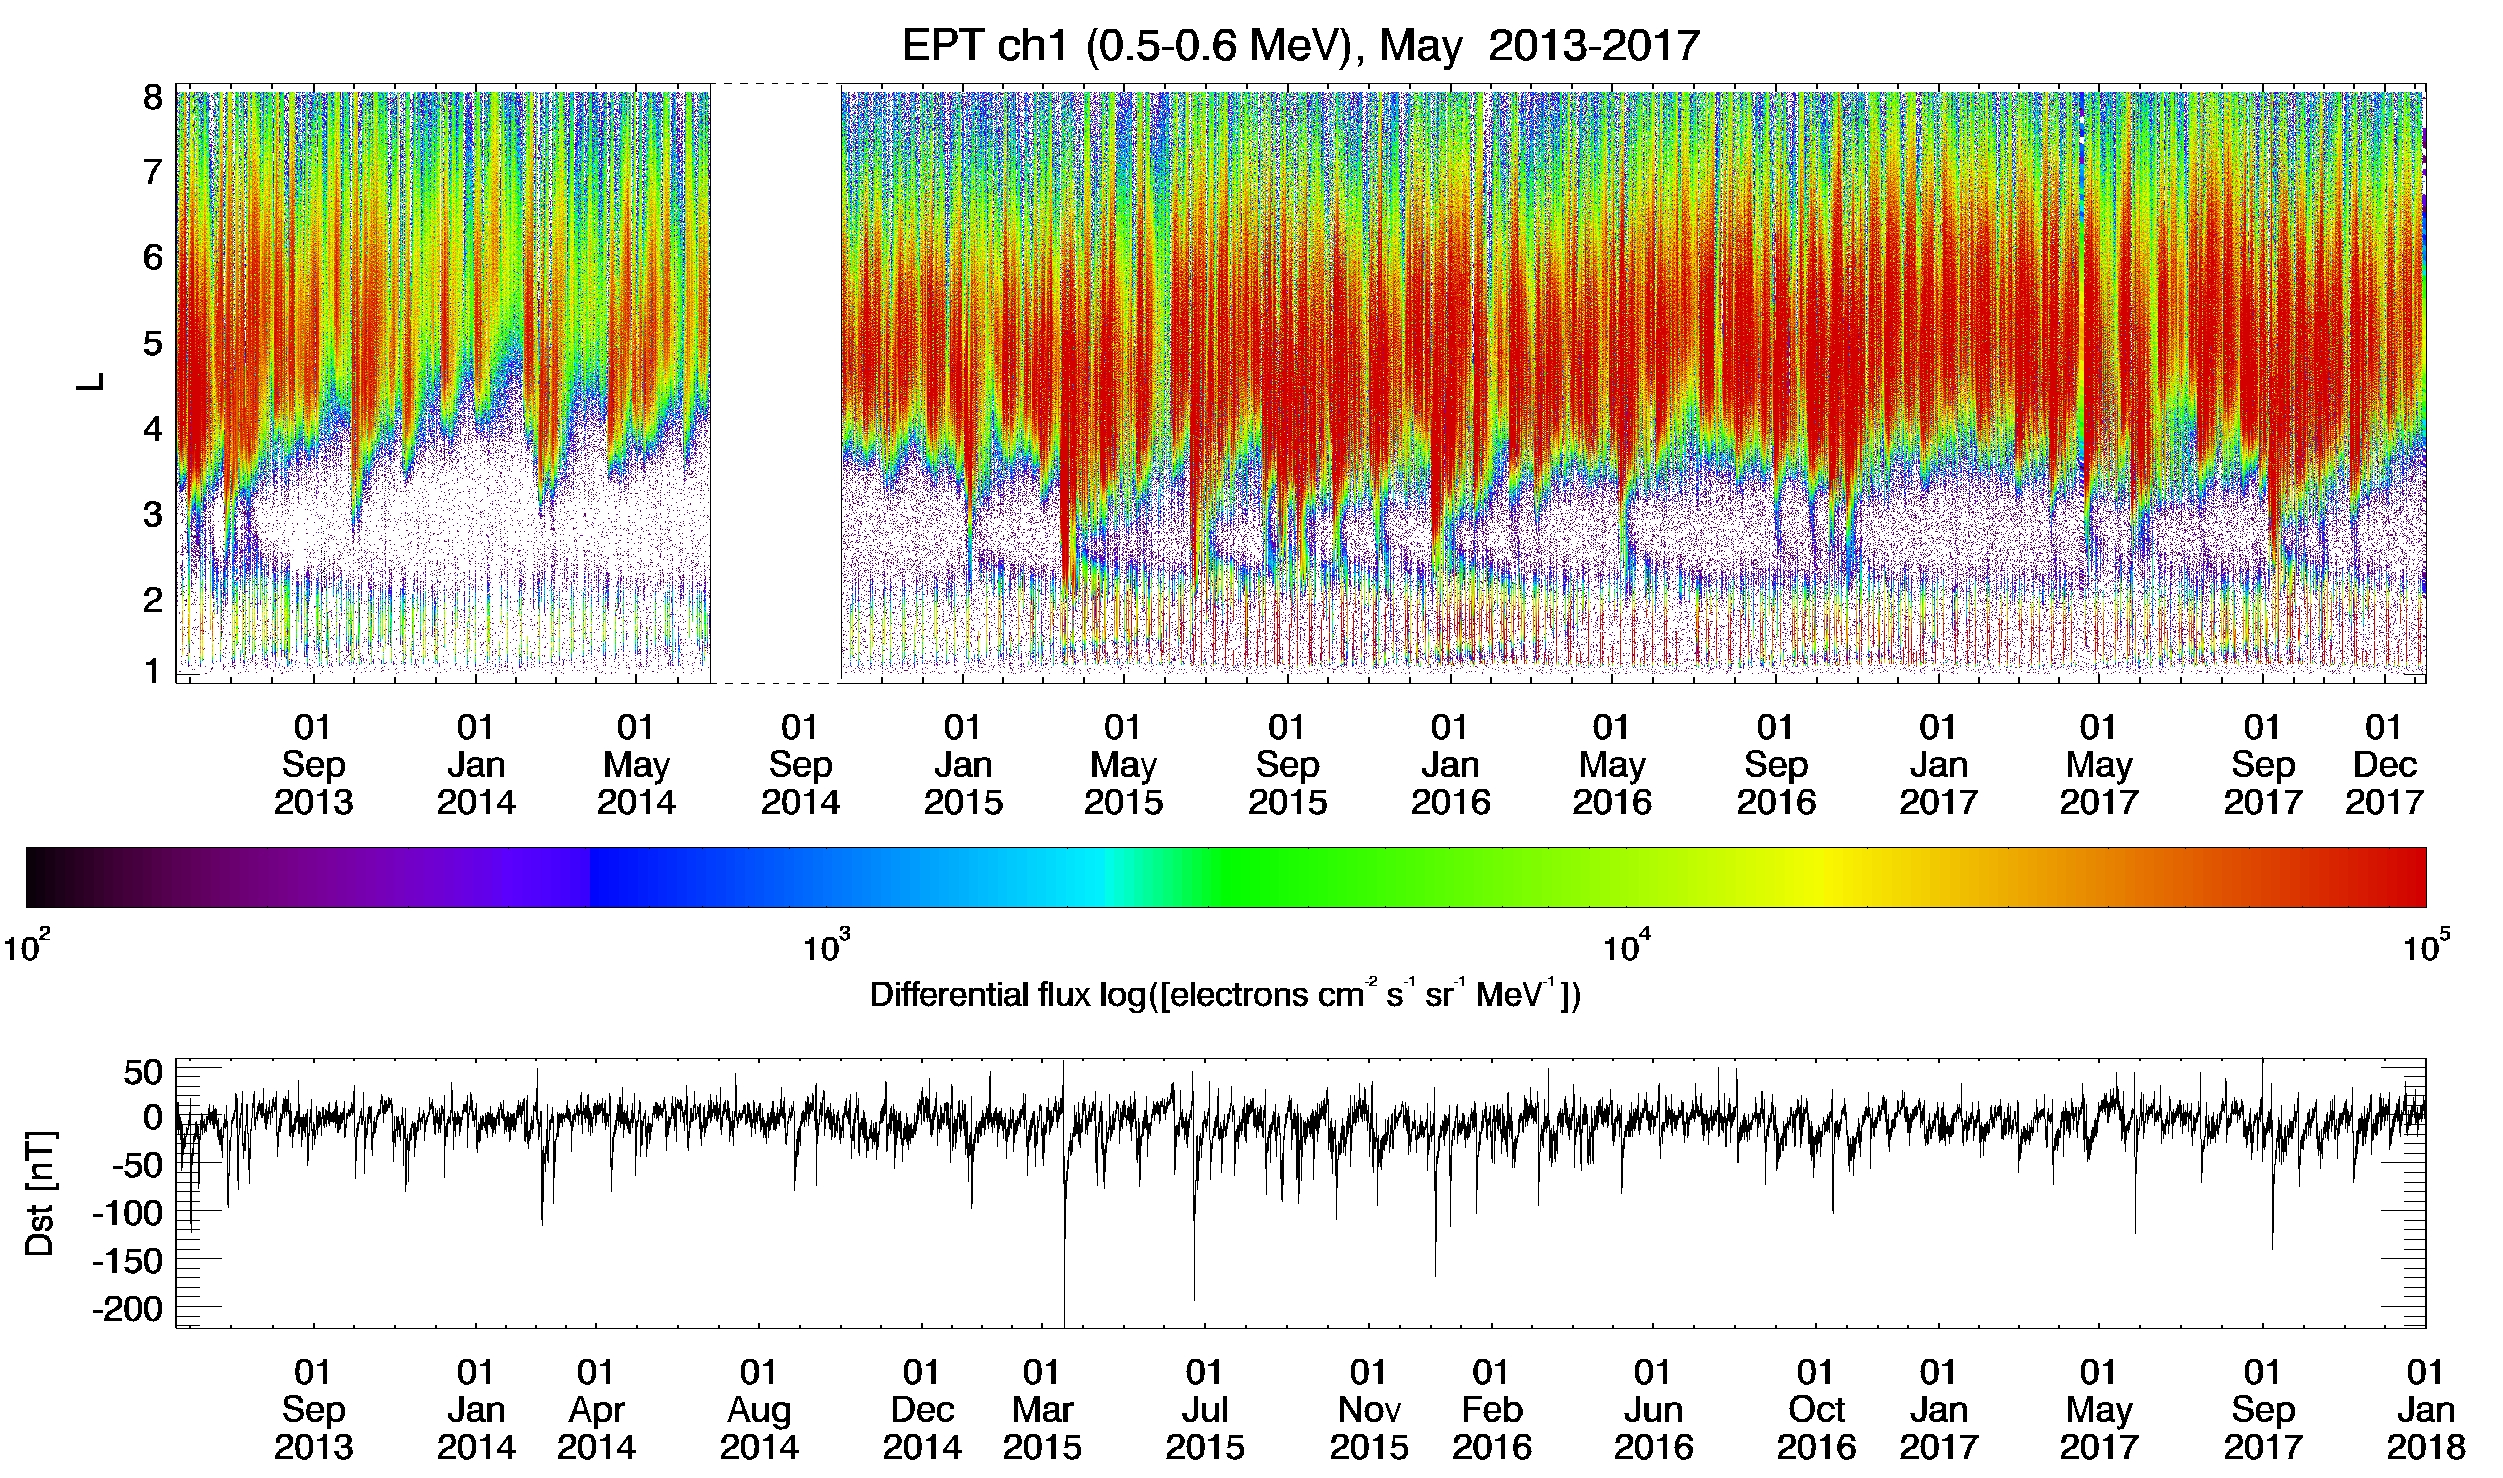
The EPT detector shows that the fluxes of electrons are very variable in the outer belt (L>4 Re). The outer belt is separated from the inner belt (L<2) by the slot region. During the strongest geomagnetic storms, clear injections in the slot and inner belt are visible. The lower panel of Figure 1 shows the Disturbed Storm Time (Dst) index during the same 5 years period. Inverted peaks of Dst correspond to geomagnetic storms.
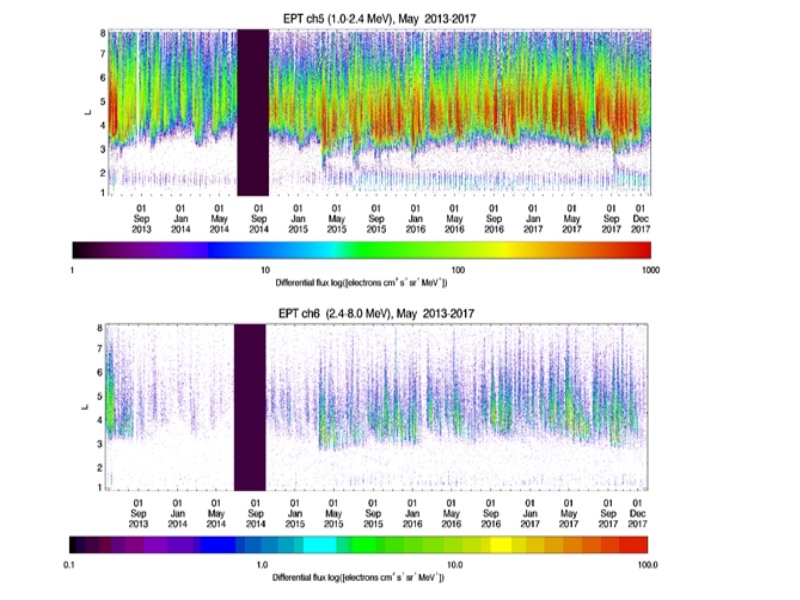
Some MeV electrons are observed in low quantities in the inner belt, even during periods when they are not observed by Van Allen Probes. They are not due to proton contamination but to injections of particles from the outer belt during the strongest geomagnetic storms of March and June 2015, and September 2017. Electrons with lower energy are injected also during less strong storms.
With the new high resolution EPT instrument, we can study the dynamics of relativistic electrons, including MeV electrons in the inner radiation belt, revealing how and when such electrons are injected and how long they reside before being scattered into the Earth’s atmosphere or lost by other mechanisms.
Flux maps
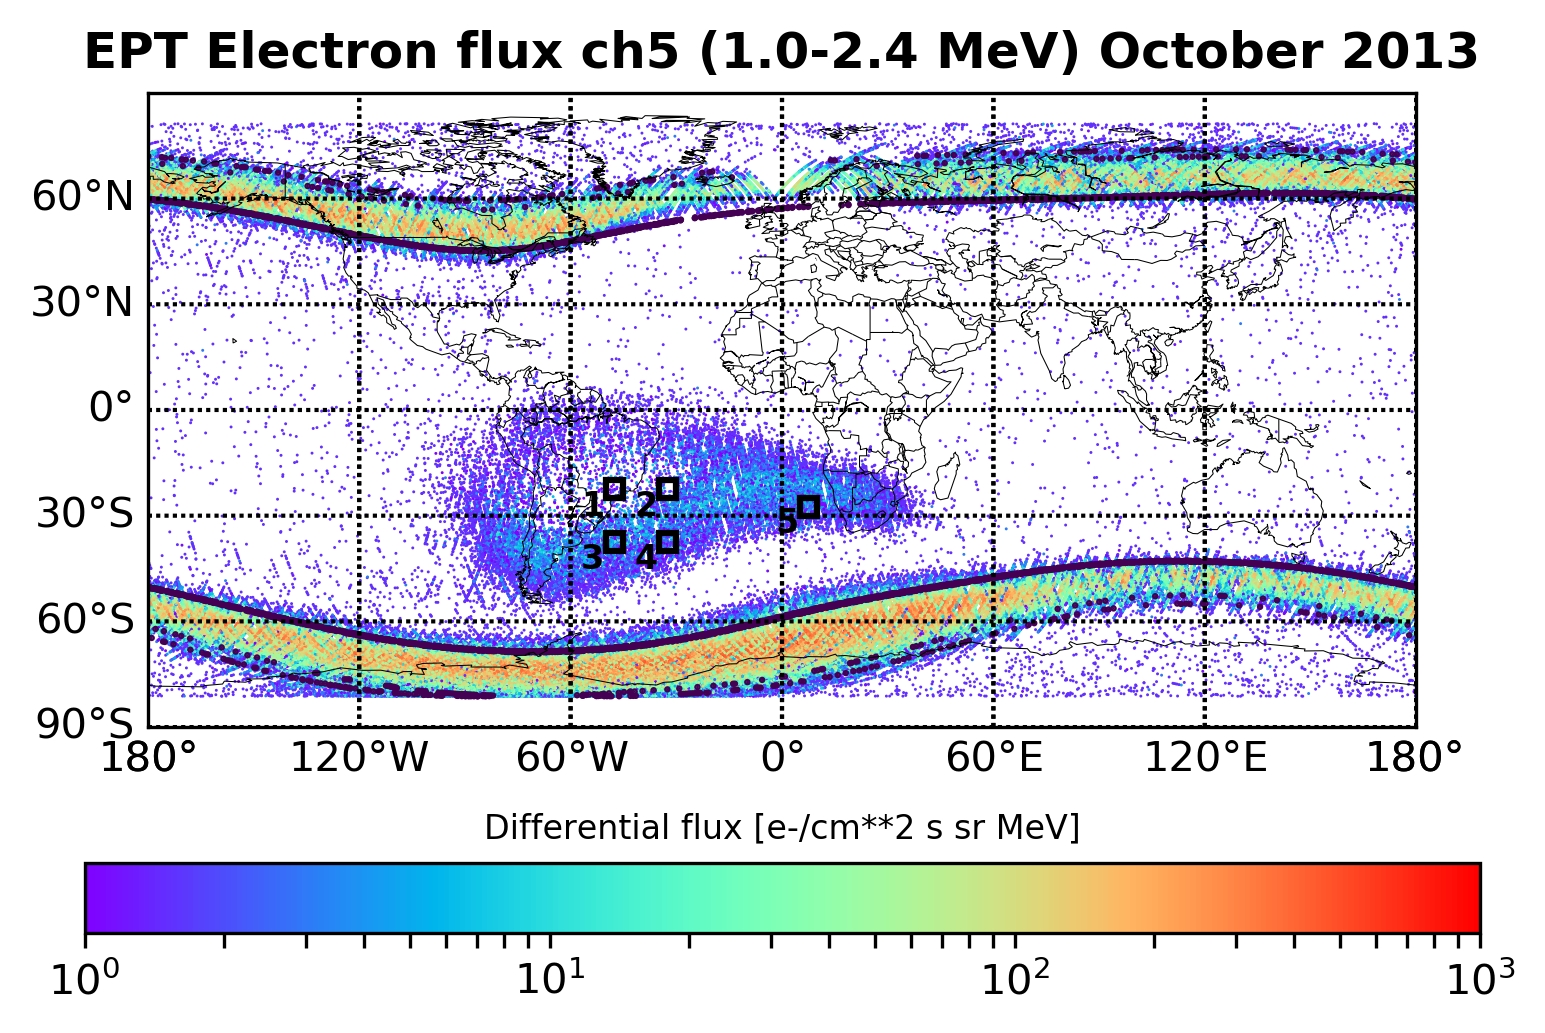
Plotted on a map at 820 km of altitude, intense electron fluxes are observed at high latitudes corresponding to the penetration of the outer belt at low altitudes, and in the South Atlantic Anomaly (SAA) corresponding to electrons trapped in the inner belt. In the SAA, two populations with different origins are observed in the North and South parts.
References:
- Katsiyannis, A.C., Dominique, M., Pierrard, V., Rosson, G.L., Keyser, J.D., Berghmans, D., Kruglanski, M., Dammasch, I.E., Donder, E.D. (2018). The detection of ultra-relativistic electrons in low Earth orbit. Journal of Space Weather and Space Climate, 8, A01. https://doi.org/10.1051/swsc/2017041

- López Rosson, G. (2018). Van Allen radiation belts dynamics revealed from PROBA V/EPT observations (doctoral dissertation). Université catholique de Louvain, Louvain-la-Neuve, Belgium. Retrieved from http://hdl.handle.net/2078.1/208083
- López Rosson, G., Pierrard, V. (2017). Analysis of proton and electron spectra observed by EPT/PROBA-V in the South Atlantic Anomaly. Advances in Space Research, 60(4), 796–805. https://doi.org/10.1016/j.asr.2017.03.022
- Pierrard, V., Lopez Rosson, G., Botek, E. (2019). Dynamics of Megaelectron Volt Electrons Observed in the Inner Belt by PROBA‐V/EPT. Journal of Geophysical Research: Space Physics, 124(3), 1651–1659. https://doi.org/10.1029/2018JA026289