


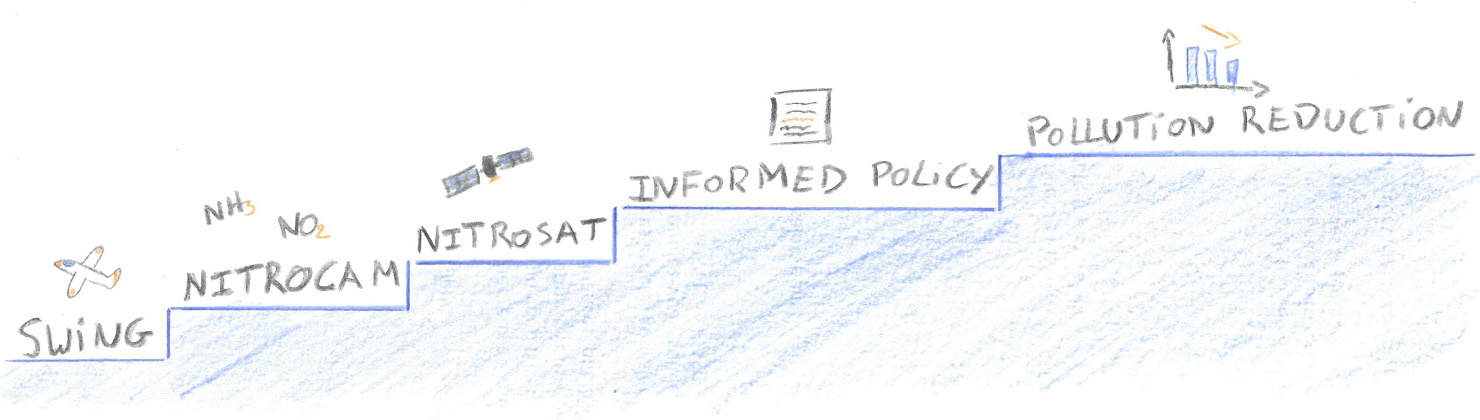
Science on wings: measuring nitrogen pollution in flight
Researchers of the Royal Belgian Institute for Space Aeronomy have no need for energy drinks in order to get airborne, they simply work together with Dr Thomas Ruhtz’s team at Freie Universität Berlin (FUB) who have an airplane at their disposal. Together with the Université Libre de Bruxelles (ULB), each of the three institutes contribute their equipment and expertise to the ESA-funded NITROCAM campaign for the measurement of air pollution due to nitrogen compounds. This in preparation of NITROSAT, a satellite dedicated to making high-resolution observations of nitrogen pollution sources, which is in the running to become ESA’s 11th Earth Explorer mission. So far, the NITROCAM campaign has not only delivered good data, but also great aerial views of some interesting landmarks!
The issue of nitrogen pollution
The problem with air pollution by nitrogen compounds like ammonia (NH3) and nitrogen dioxide (NO2) is that they can create fine particles in the atmosphere. These fine particulates deteriorate air quality and affect visibility, but they can also cause serious respiratory and cardiovascular problems, especially to vulnerable individuals. NO2 in itself is also harmful as it can irritate the lungs and cause a deterioration of its function. In high concentrations, it can contribute to the development of respiratory diseases like asthma, can worsen the symptoms of such diseases and can increase susceptibility to respiratory infections.
Furthermore, when an excess of nitrogen compounds is released into the atmosphere, these can wreak havoc on many earth and water-based ecosystems. They cause the acidification of the soil, thus interfering with the growth of plants in the wild or in agriculture. When they are dissolved in water, they impact the chemical processes and balance, which can lead to health issues and even death of marine and freshwater life. These effects lead to other consequences that are detrimental to our society. Planet Earth being a global domino set-up, one falling tile can cause the fall of a long series of others, even if they appear far away from each other.
Having established nitrogen pollution as a problem, the necessity for regulation and policies to control and reduce it becomes clear, but policy-makers cannot act without information and subsequent monitoring of the impact of decisions. This part is our task. Together with ULB and other European partners, our aim is to prepare and launch a satellite called NITROSAT, specifically dedicated to observing sources and monitoring levels of nitrogen pollution at the unprecedented resolution of 500 m2. This means that NITROSAT could distinguish between sources that are only 500 m apart, a distance that an athlete can run in less than 60 seconds. A true technological feat, if achieved! (For the satellite, not the athlete. Though it is also a feat for the athlete, of course, just not a technological one, if one doesn’t count high-tech sports equipment.)
NITROCAM then NITROSAT: a proposed solution
If you met NITROSAT for the first time at a friend’s party, the satellite mission would introduce itself as follows:
- I am currently starting my phase of scientific and industrial pre-development, as I have recently been approved by the European Space Agency as one of the candidates for the 11th Earth Explorer mission.
- I should know if I get the job in 2025.
- If my scientists and engineers manage to get me the job of 11th Earth Explorer mission, I will continue development and be launched into orbit around 2031-2032.
With the general introductions made, we can dig a little deeper into NITROSAT’s biography, specifically into one part of its development phase: NITROCAM. NITROCAM is a set of measurement campaigns dedicated to the preparation of the NITROSAT mission and performed by the airborne team at BIRA-IASB, in cooperation with ULB and FUB. On our side, the airborne team is composed of researchers and engineers who have developed an instrument called SWING, that was mounted into a small airplane from FUB. With SWING, they make local measurements of the NO2 horizontal distribution under the aircraft.
Besides SWING a TELOPS HyPER-Cam LW from the German Centre for Geosciences (GFZ) is integrated to measure NH3 in the thermal infrared. Together, the instruments can be seen as an airborne demonstrator for the future NITROSAT space mission. The spatial resolution of the collected data will be resampled as if it was collected from space and specifications like the sensitivity etc. will be assessed.
The first scientific flights took place in Germany in fall 2020 and spring 2021 and already enabled a first joint detection NH3 and NO2 from an industrial site. In May and June 2022, the campaign focused on Italy, which is interesting in particular for its good weather statistics, as weather conditions are a key factor for our remote-sensing observations.
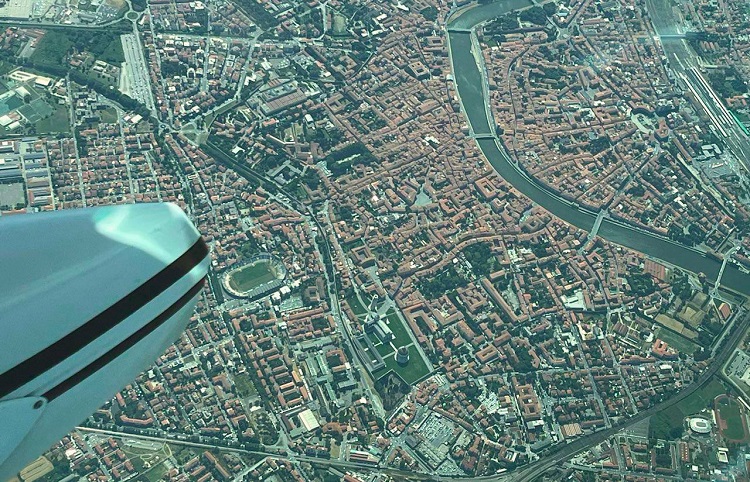
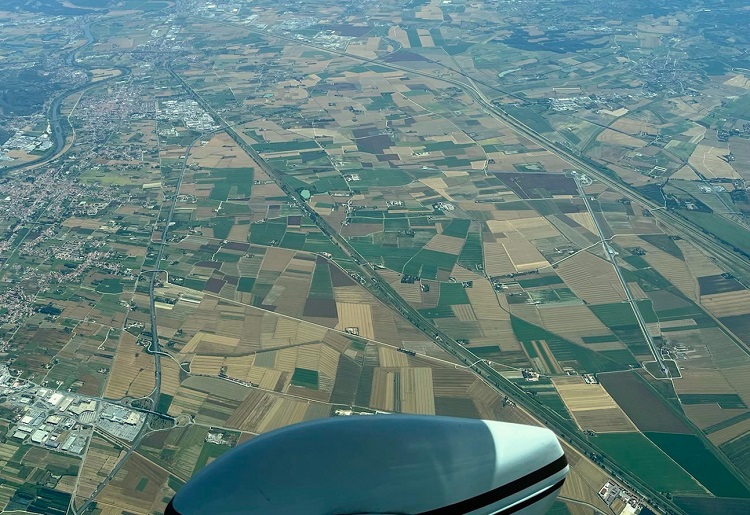
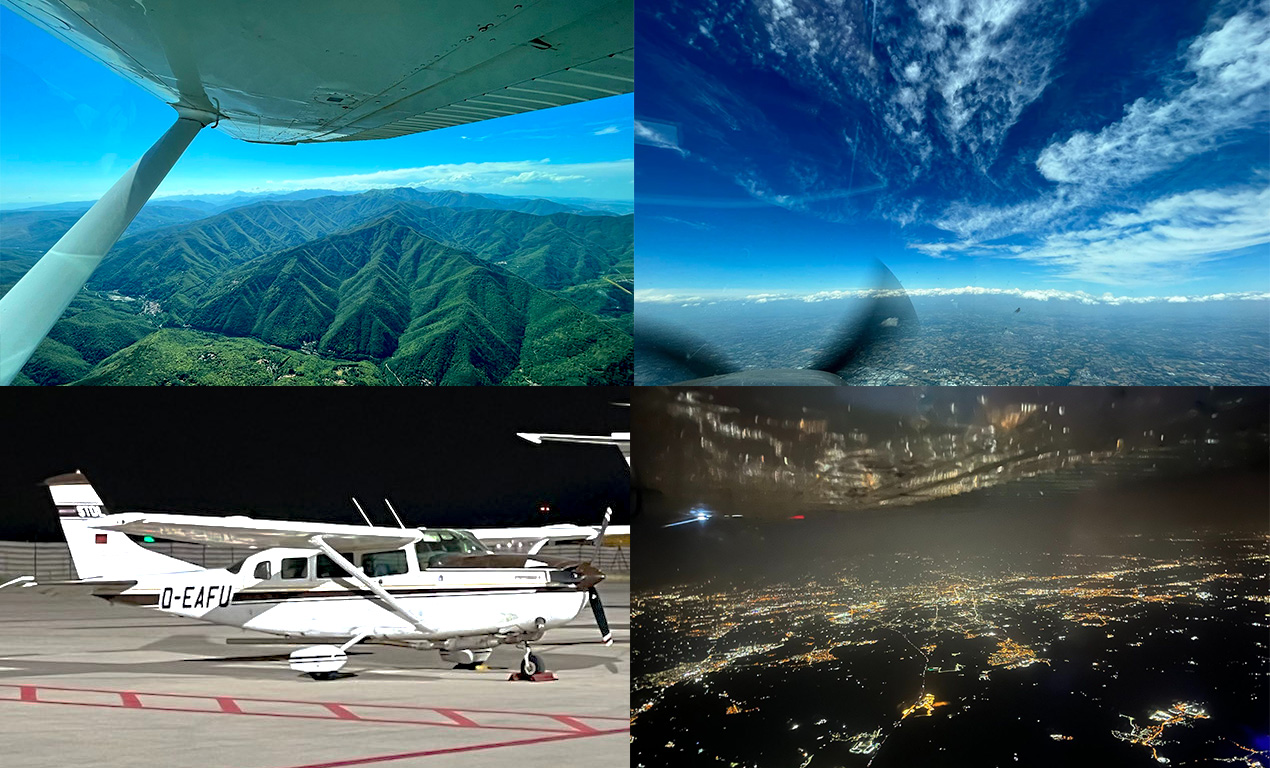
A few weeks ago, they took SWING and the Hyper-Cam for a ride over the Pisa province in Tuscany in FUB’s Cessna airplane, resulting in a few neat snapshots of both the famous leaning tower and the scientific research facility for the detection of gravitational waves VIRGO.
The challenge of airborne measurements
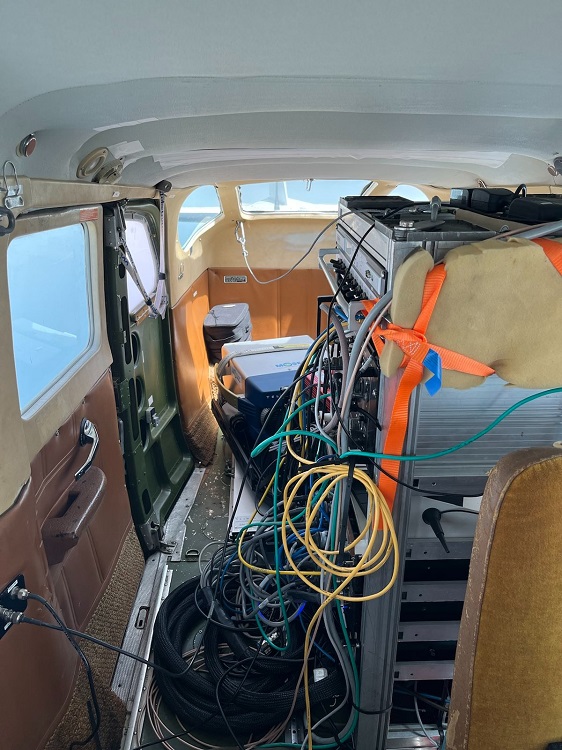
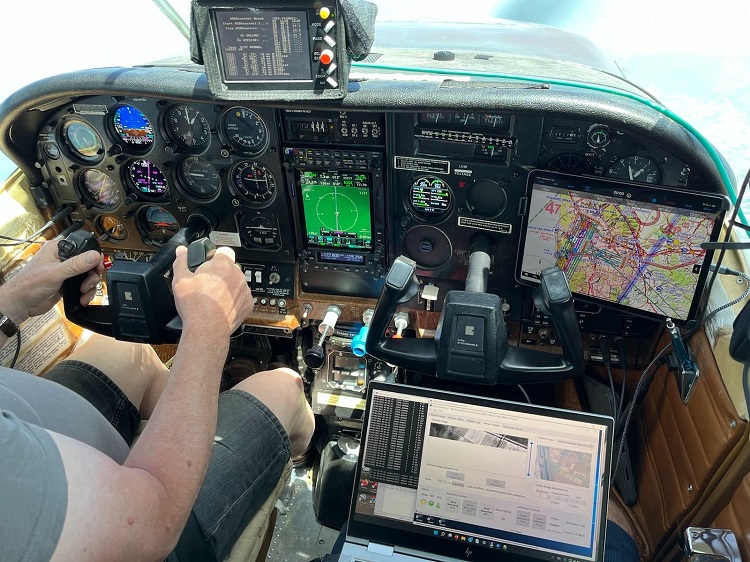
Besides necessitating an adventurous, non-claustrophobic scientist unafraid of heights, collecting data from aboard a small airplane poses other difficulties. For instance, plane(especially small ones) do not fly in a precisely straight line. Crosswinds coming from its sides will slightly blow it off course despite corrections made by the pilot. This isn’t ideal for scientific research like the precise mapping of pollutant sources, so the incoming data needs to be corrected for these deviations from the line. The solution to the problem is visible in the picture of Fig. 5.
In the back of the plane, you can see the Hyper-Cam instrument. Interestingly, it is not positioned parallel to the airplane, but slightly askew. It is actually mounted on a stabilisation platform that rotates according to the amount and direction of crosswind that the plane is undergoing, thus keeping the instrument measuring in a consistent linear pattern and saving the scientists a lot of trouble!
In the picture, there appears to have been a lot of crosswind because the platform is rotated to the most extreme right position (from the perspective of the airplane).
Some preliminary results
Agriculture is one of the main sources of particulate matter, so reducing the emissions of NH3 by agricultural practices is key to reducing air pollution and mitigating its harmful consequences. According to a 2019 report from the European Environment Agency, NH3 emissions from agriculture were in a rising trend. Consequently, the flights in Italy focused greatly on agricultural sources, though industrial sources of NH3 were targeted as well. A nice example of such source in the area is the sodium carbonate (or soda ash) plant of Rosignano. The northeastwardly plume is clearly visible in figure 7.
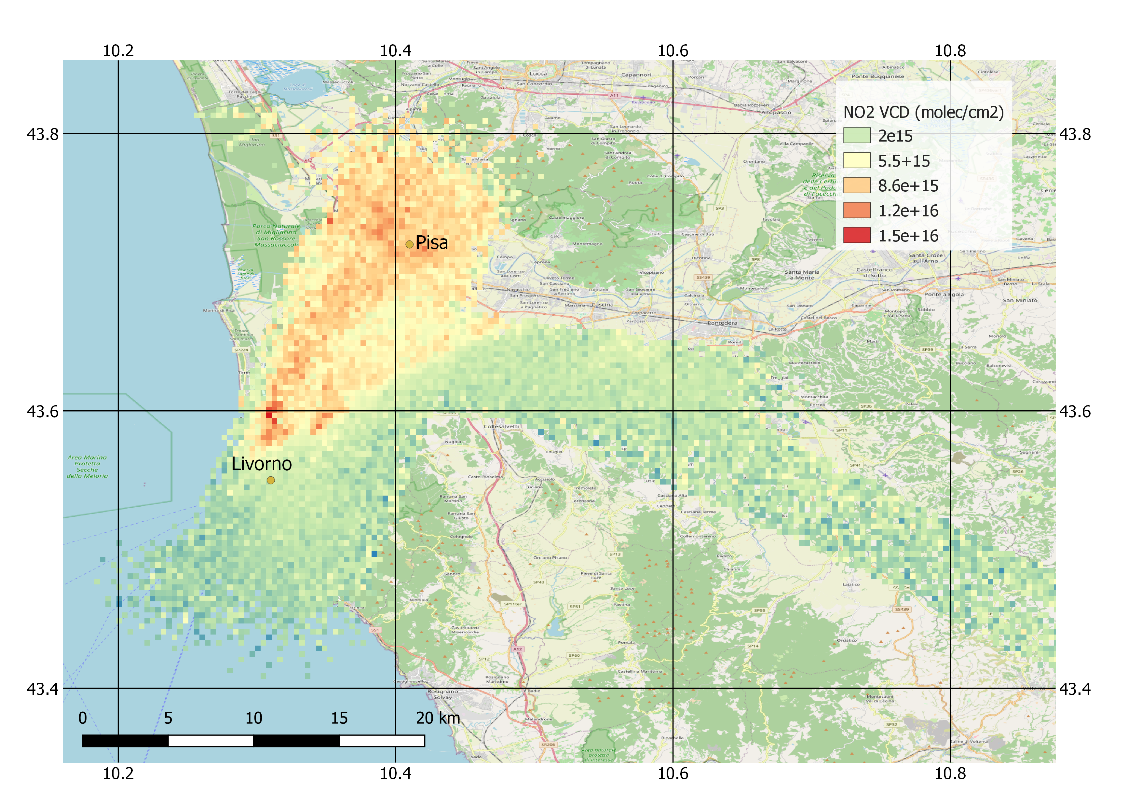
Regarding NO2, its largest sources are linked to human activity like combustion processes e.g. in thermal engines or industrial stacks. Figure 6 shows the NO2 abundance around Pisa and Livorno on 20 June 2022. Two plumes originate from Livorno: one from the center and harbour, the second one from an industrial area comprising refineries.
The promising dataset collected during NITROCAM demonstrated the feasibility of jointly observing NO2 and NH3 from a compact nadir-looking instrumental set-up (looking straight down at the ground). This is an important step in the preparation of a space-borne mission, which helps to verify the overall concept and motivates future work. You will probably hear more about NITROSAT in the future!
News image 1
News image legend 1
News image 2
News image legend 2
News image 3
